New Customer Hours
Mon - Sat: 9:00am - 5:00pm
Customer Care Hours
Mon - Sat: 9:00am - 5:00pm
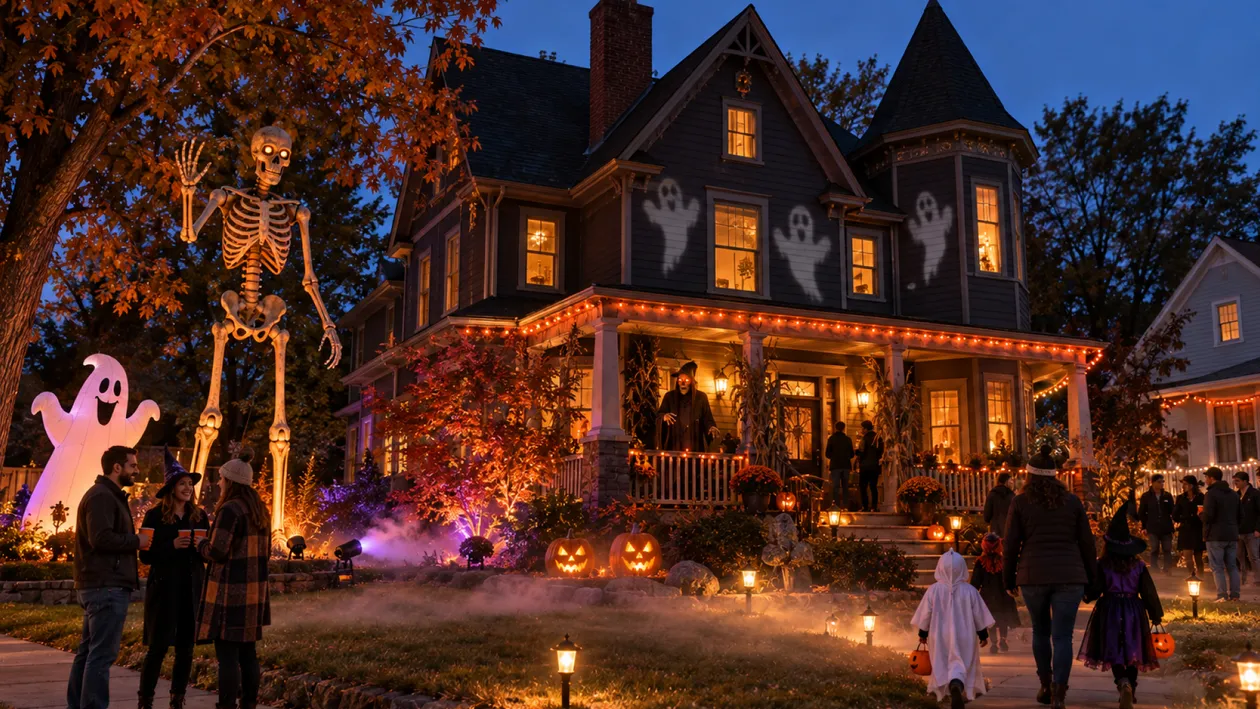
Halloween falls on a Saturday this year, and the string lights, inflatables, and 12-foot skeletons are already going up across the country. Most of those displays draw power for hours every night, which raises a fair question about what they add to the October electric bill. Payless Power looked at the answer from two directions. We analyzed federal data on what households in all 50 states paid for electricity in October over the past decade, and we surveyed more than 1,000 Americans about how energy costs are affecting their decorating.
The answer depends on where the bill starts. Texas heads into the season paying the second-highest October electric bill in the country, up 38% in a decade, so every string of lights lands on top of a bill already $55 above the national median. Nationally, the decorations turn out to be a small line on the bill. The bigger story is what people are doing about it, and more than 1 in 3 Americans have already cut back.
Key Takeaways
- Texas households pay the second-highest October electric bill in the country at $175, $55 above the $120 national median.
- Hawaii ($220), Texas ($175), and Florida ($172) have the highest average October electric bills in the country, while New Mexico ($85), Utah ($86), Idaho ($92), and Nevada ($92) have the lowest.
- Massachusetts (+68%), California (+64%), and Maine (+59%) have seen the biggest 10-year increases in October electric bills, while Nevada is the only state where the bill has fallen (-16%). South Carolina (+17%), Arizona (+18%), and New Mexico (+18%) rose the least.
- More than 1 in 3 Americans (37%) have cut back on Halloween decorations because of rising energy costs.
- Nearly 1 in 3 Americans (31%) are spending less on Halloween decorations than last year.
- Nearly half of Americans (48%) say Halloween decorations have become more expensive than they are worth.
- In October, Texas homes use 59% more electricity than the typical state and pay the median rate, so the high bill is due to usage, not price.
Which States Pay the Most for Electricity in October?
Before a single string light is plugged in, the October electric bill already looks very different from one state to the next. Here’s where households pay the most, and the least, heading into Halloween.
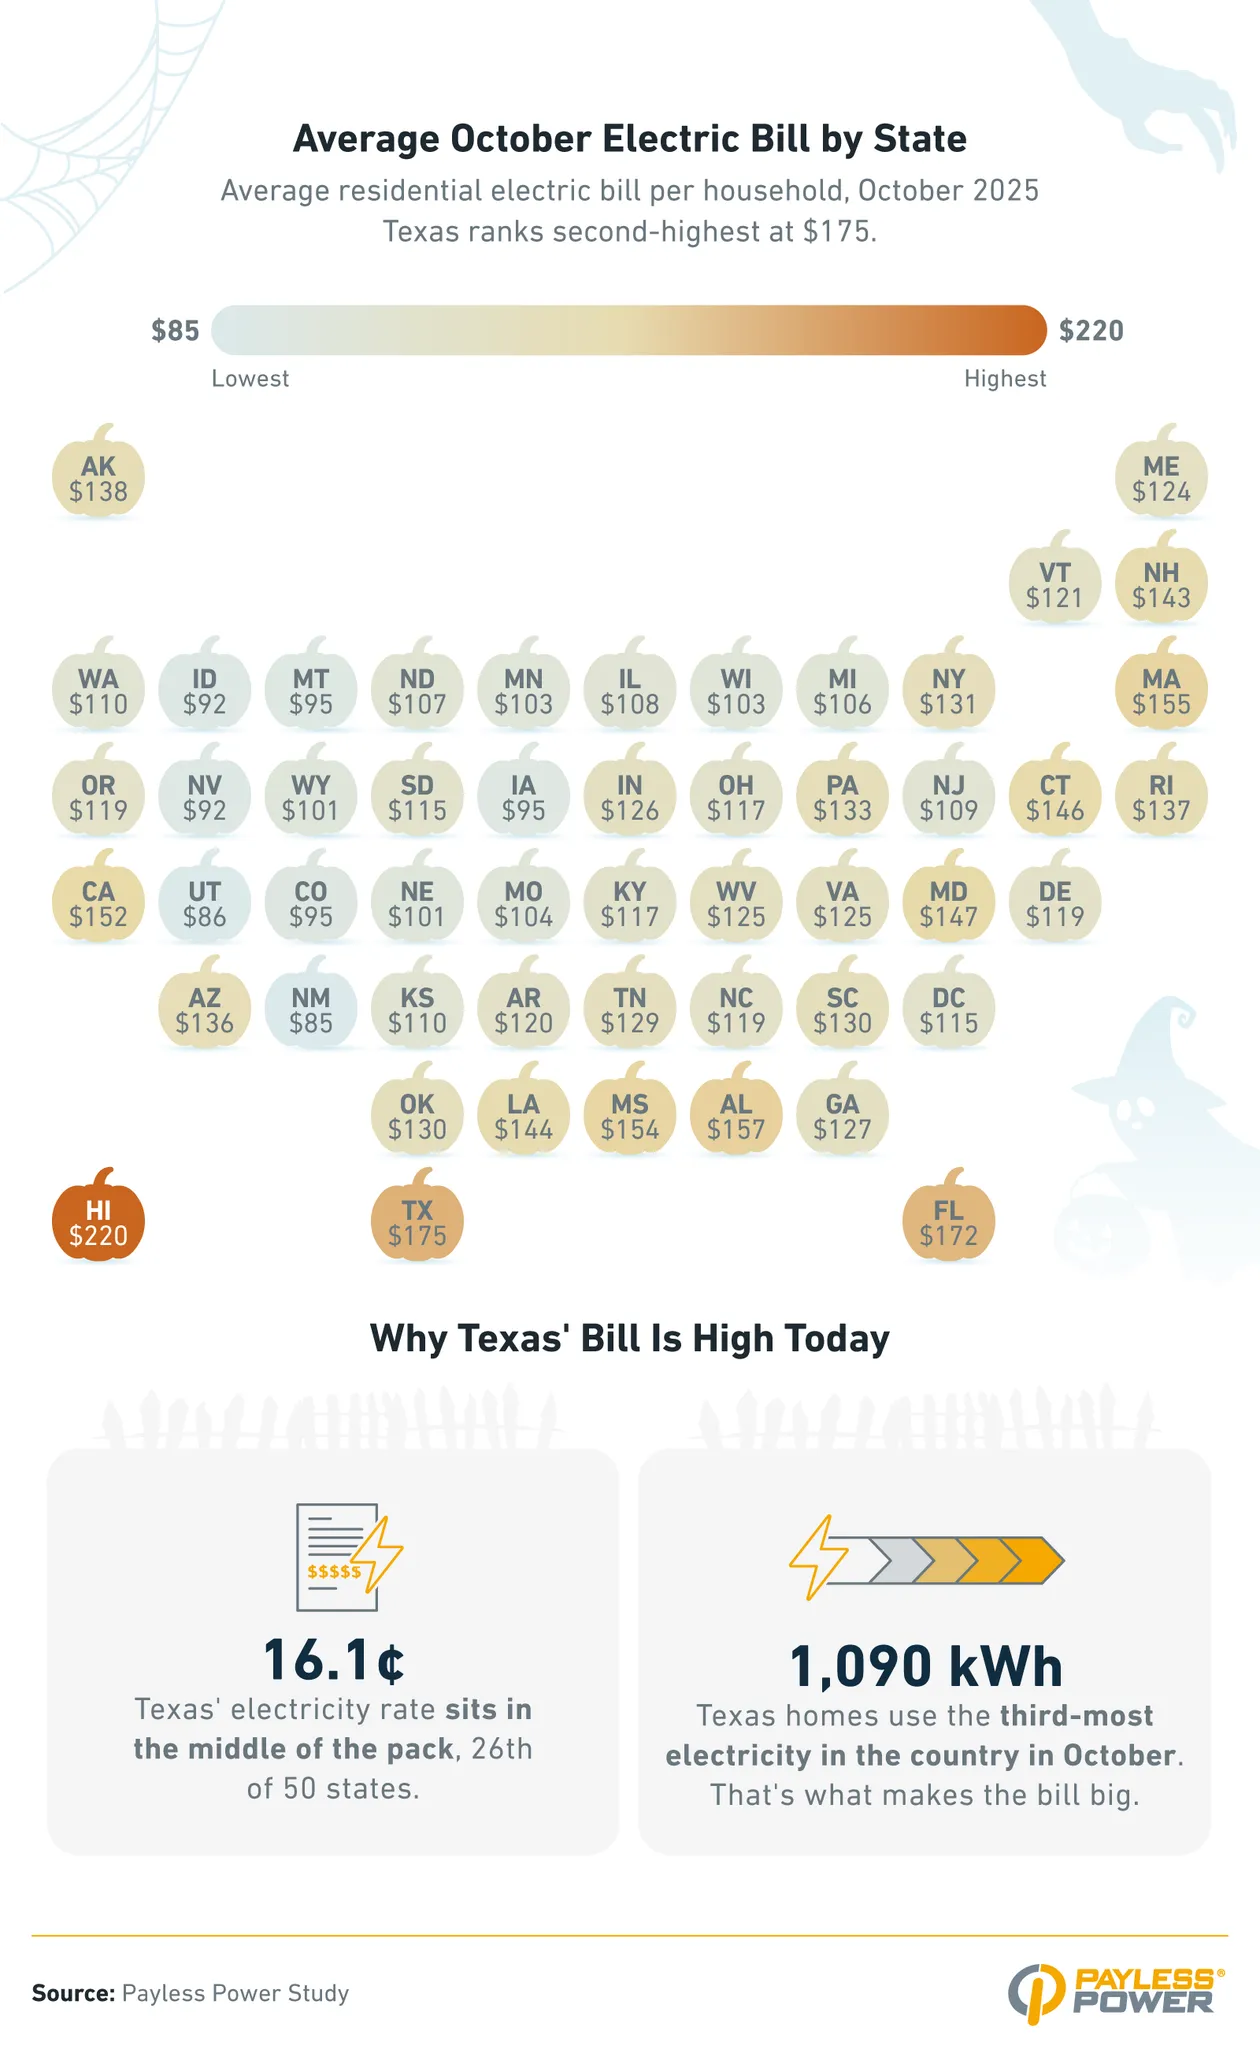
- Texas households pay the second-highest October electric bill in the country at $175, $55 above the $120 national median.
- Hawaii ($220), Texas ($175), and Florida ($172) have the highest average October electric bills in the country, while New Mexico ($85), Utah ($86), Idaho ($92), and Nevada ($92) have the lowest.
- Texas homes use 59% more electricity than the typical state in October and pay the median rate, so the high bill comes from usage, not price.
- 7 states had an average October bill of $150 or more in 2025. They were Hawaii, Texas, Florida, Alabama, Massachusetts, Mississippi, and California. In 2015, only Hawaii did.
- Texas ranked among the six highest October bills in every one of the past 11 years and among the top three in seven of them.
- Louisiana homes used the most electricity in October at 1,159 kilowatt-hours, followed by Florida (1,095) and Texas (1,090). Louisiana’s low rate kept its bill at $144, the 10th highest.
How Much Have October Electric Bills Risen in 10 Years?
The October bill has been climbing just about everywhere. We tracked the average household bill in every state from October 2015 to October 2025 and compared Texas with the national median.
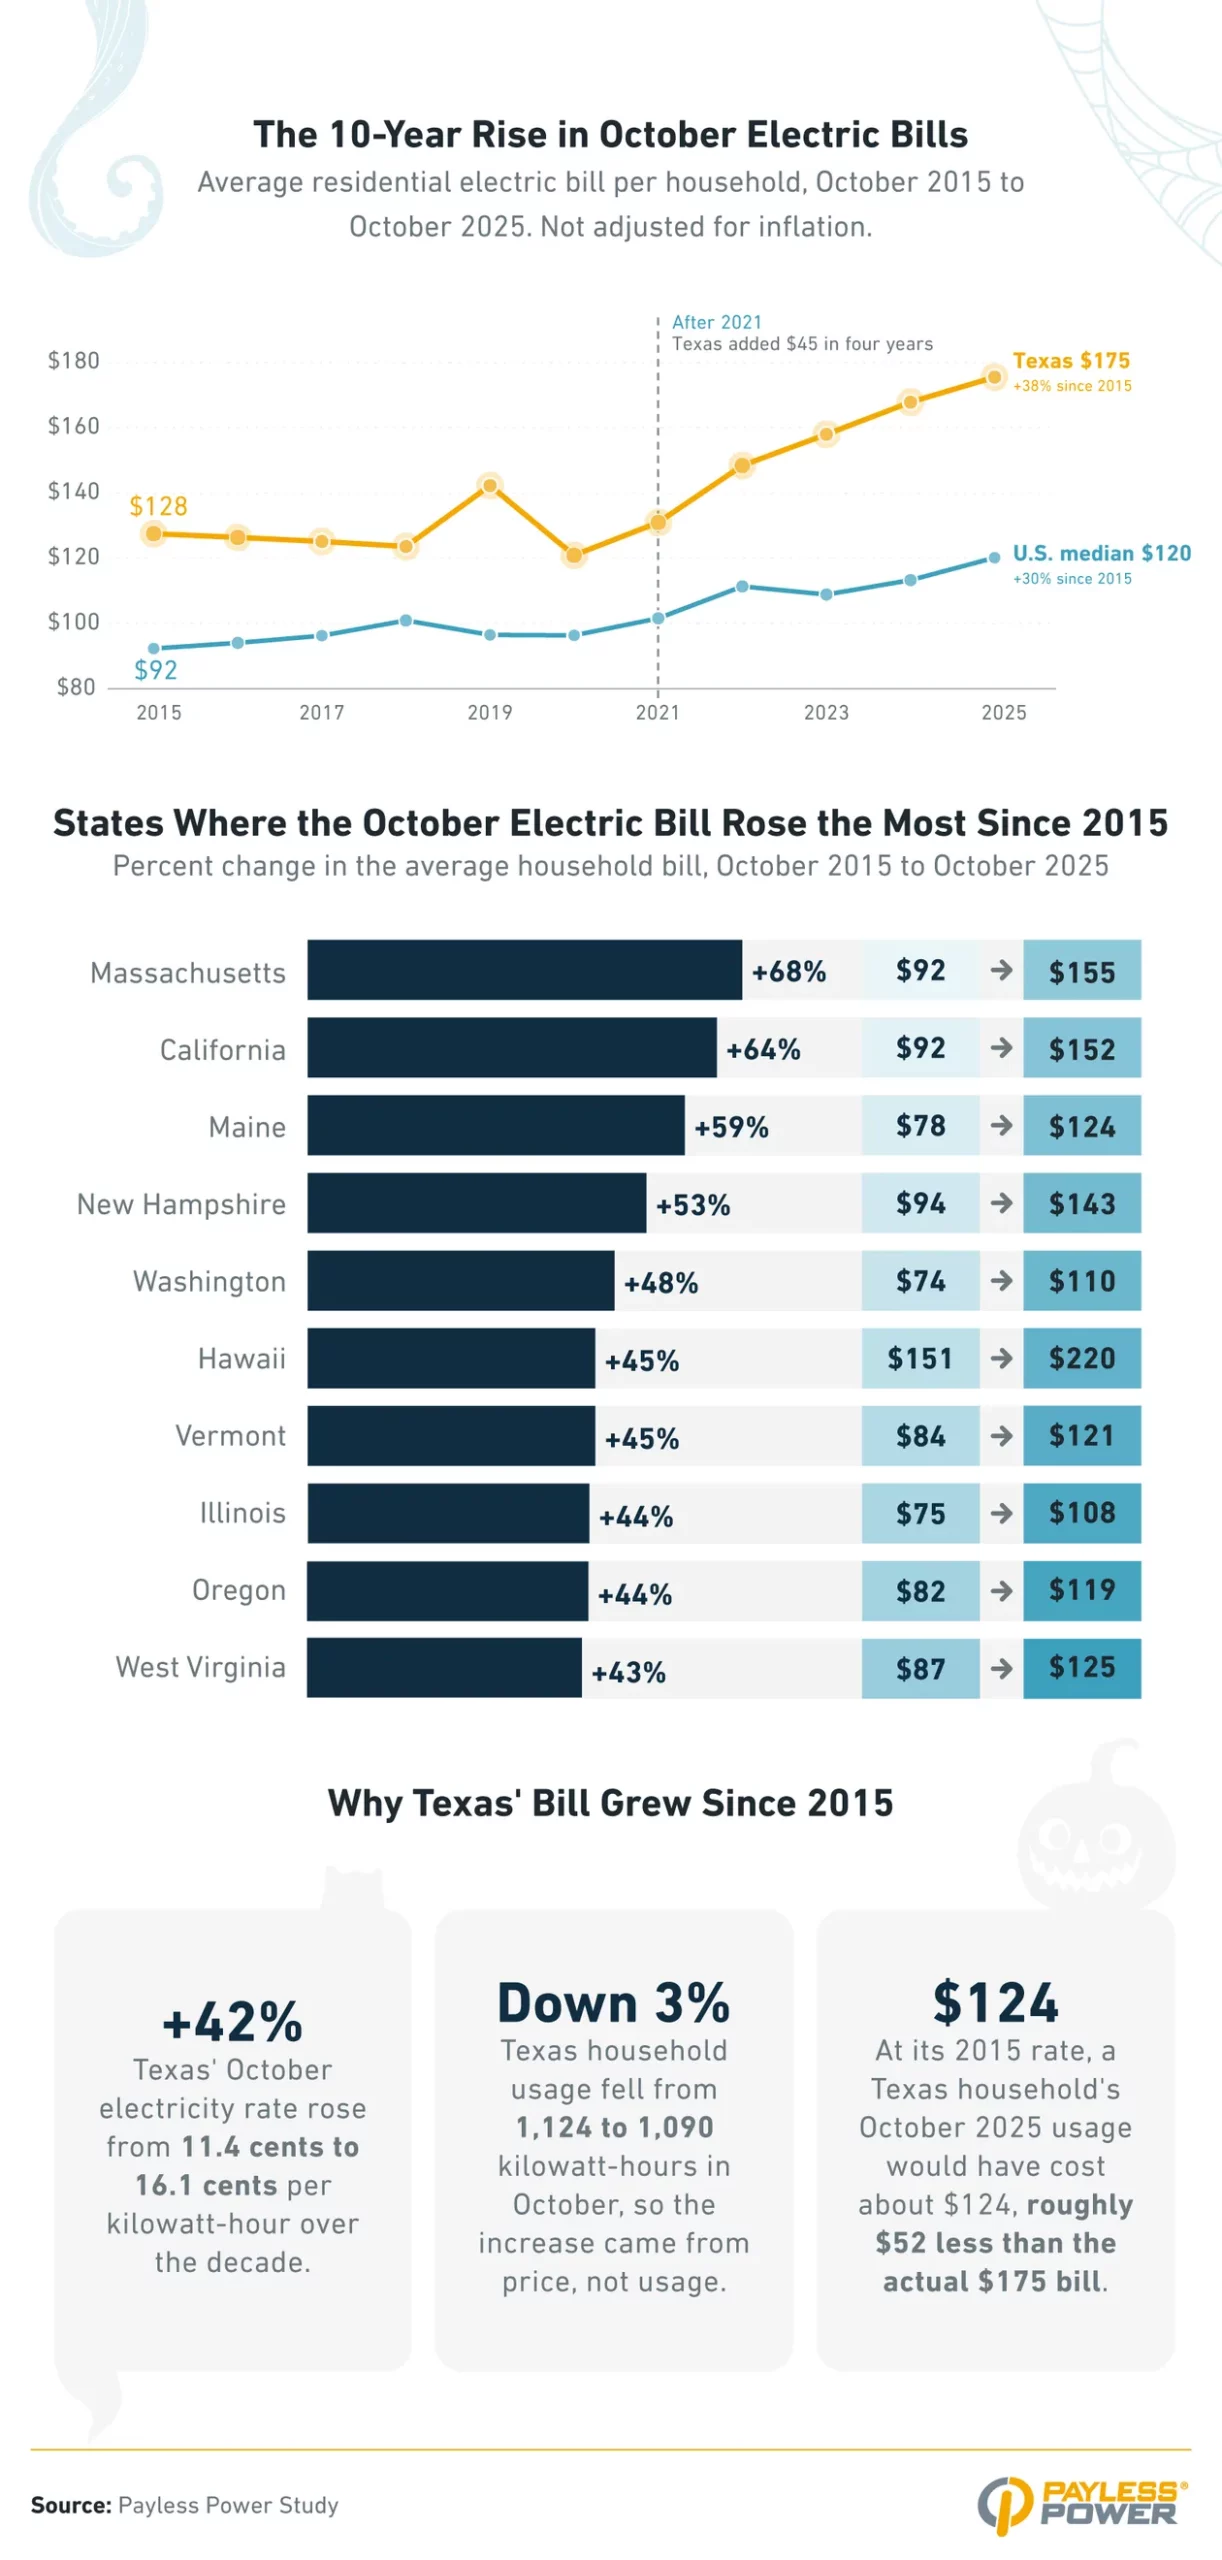
- Texas’ October electric bill is up 38% since 2015, from $128 to $175, and $45 of that increase came in the four Octobers after 2021.
- Massachusetts (+68%), California (+64%), and Maine (+59%) have seen the biggest 10-year increases in October electric bills, while Nevada (down 16%) is the only state where the bill has fallen. South Carolina (+17%), Arizona (+18%), and New Mexico (+18%) rose the least.
- The national median October bill rose 30% over the same decade, from $92 to $120, so Texas outpaced the typical state.
- Fifteen states saw their October bill rise 40% or more between 2015 and 2025.
- California’s rate more than doubled over the decade, from 15.0 cents to 33.6 cents per kilowatt-hour. Households there cut usage 27%, which held the bill increase to 64%.
- At its 2015 rate, a Texas household’s October 2025 usage would have cost about $124. Rate increases account for roughly $52 of the current $175 bill.
How Are Energy Costs Changing the Way Americans Decorate?
Rising energy costs have reached the front yard. We asked Americans whether those costs have changed how they decorate for Halloween and how their spending compares with last year.
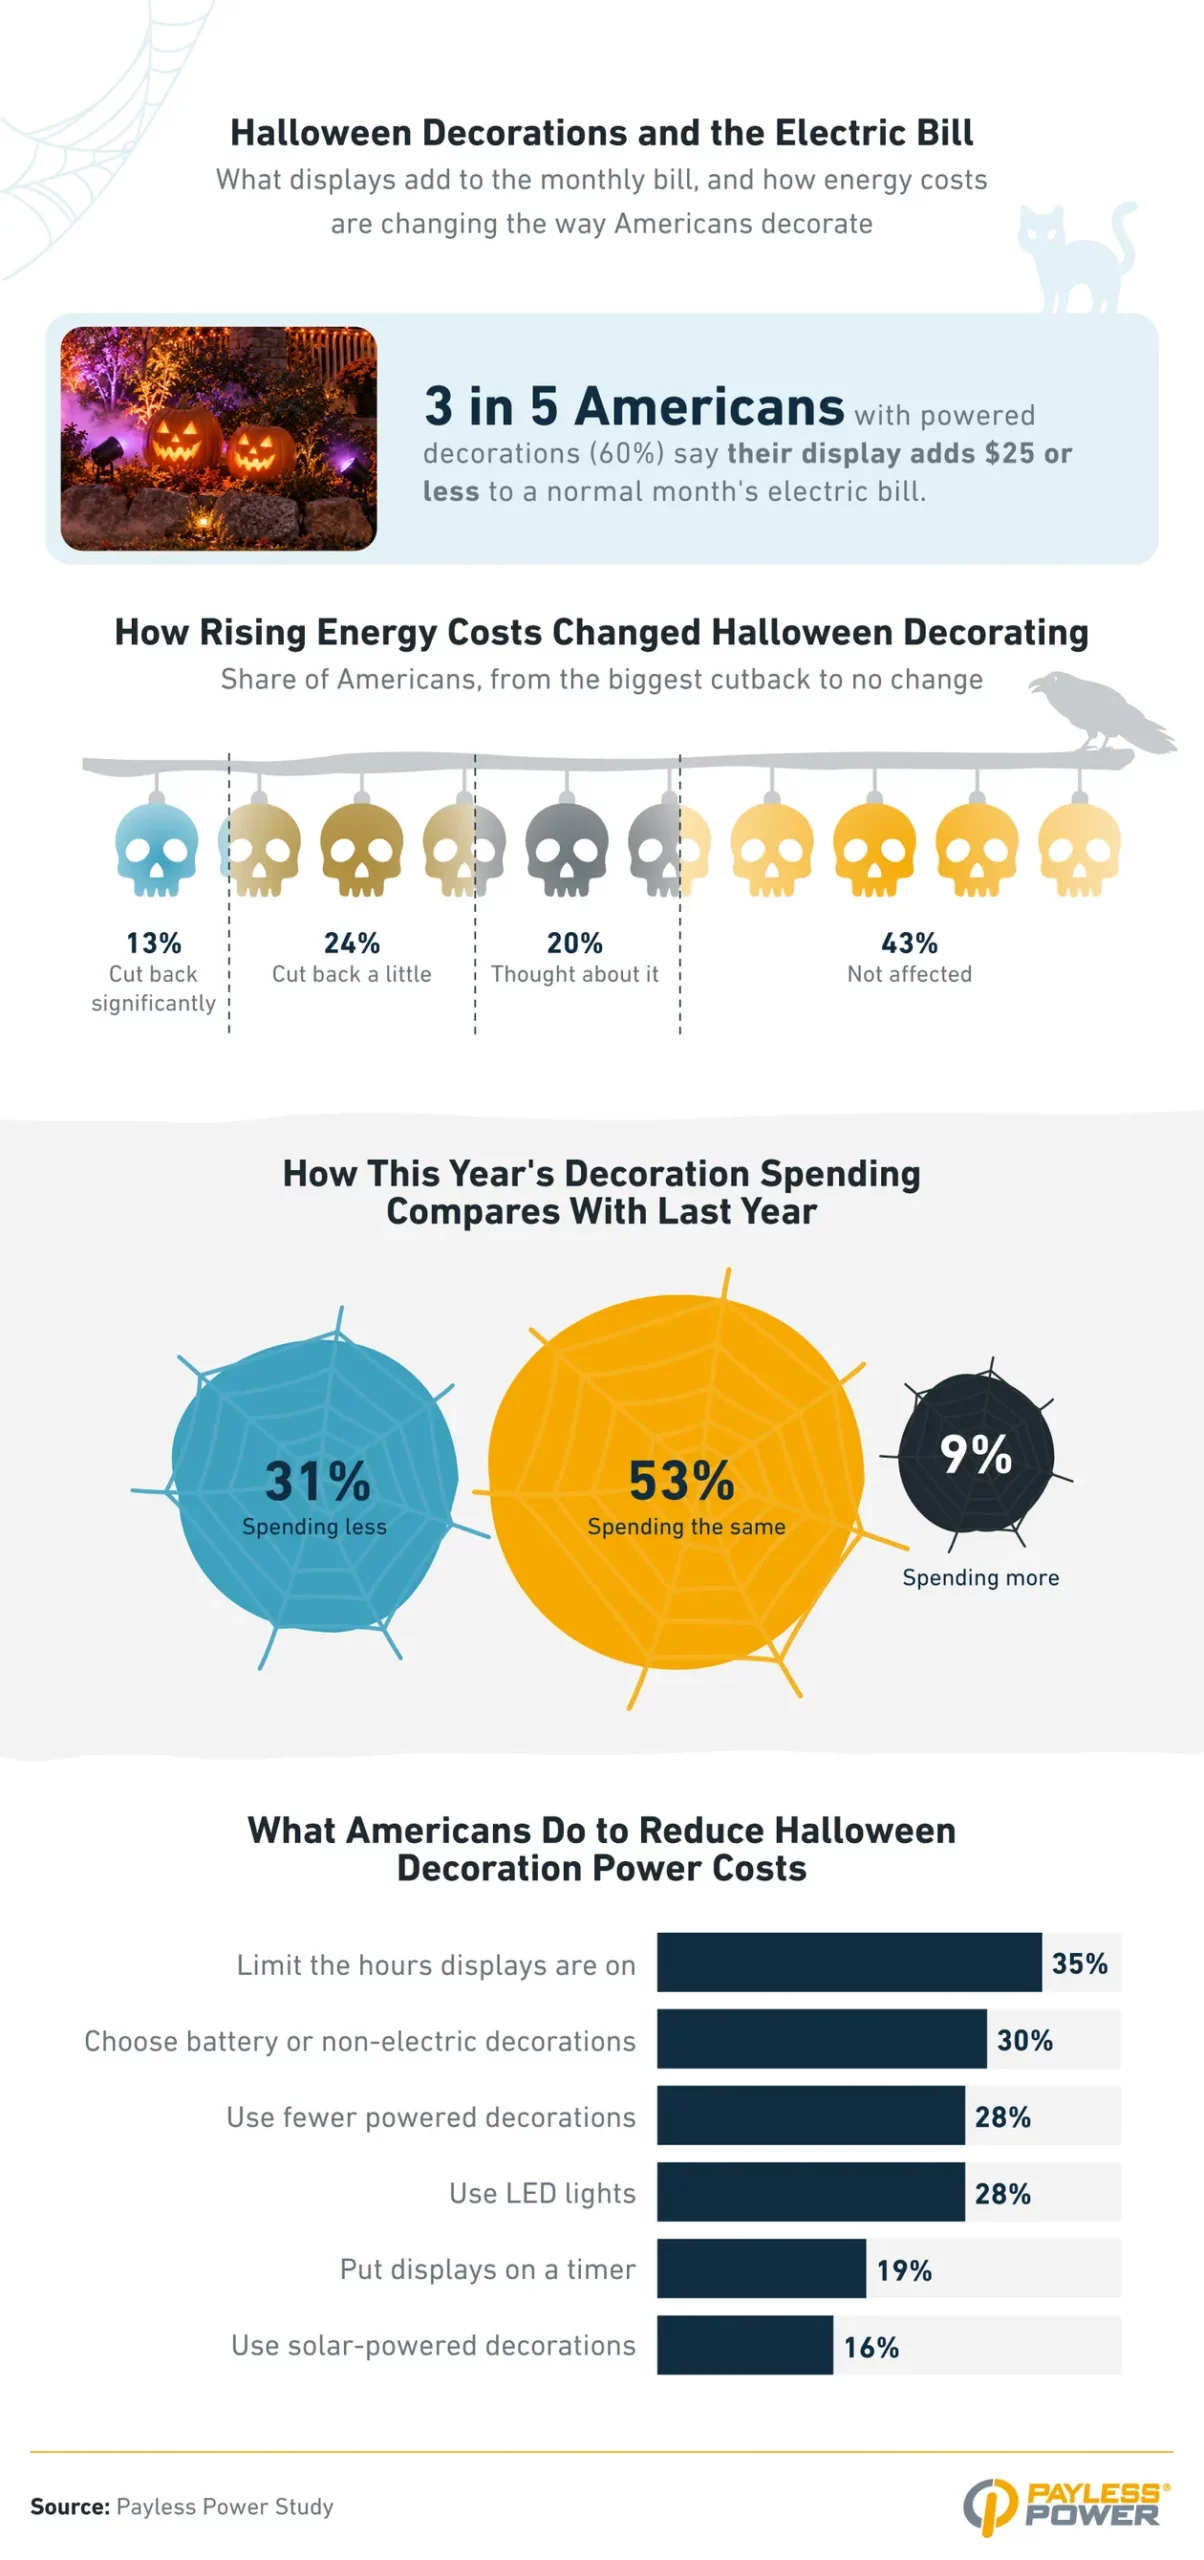
- More than a third of Americans (37%) have cut back on Halloween decorations because of rising energy costs.
- Nearly 1 in 3 Americans (31%) are spending less on Halloween decorations than last year.
- About half of Americans (48%) say Halloween decorations have become more expensive than they are worth.
- Nearly 4 in 5 Americans (78%) use at least one powered Halloween decoration. String lights (45%) and lit jack-o’-lanterns (45%) are the most common, followed by light-up figures or pathway lights (28%), inflatables (18%), projectors (14%), giant figures such as 12-foot skeletons (12%), fog machines (11%), and animatronics (9%).
- Baby boomers are the most likely to spend less on decorations than last year (41%), followed by millennials (33%), Gen X (31%), and Gen Z (23%), while Gen Z is the most likely to spend more (13%).
- Nearly 1 in 4 Americans who use powered decorations (24%) have been surprised by a higher electric bill because of their Halloween display. Millennials (29%) and Gen Z (27%) were the most likely, while Gen X (15%) was the least likely.
- Among Americans who use powered decorations, 1 in 3 (33%) said their display adds $26 or more to a normal month’s electric bill, and more than 1 in 10 (12%) said $51 or more. About 1 in 5 (21%) noticed no increase.
- About three-quarters of Americans (74%) took at least one step to keep electricity costs for decorations down. Women were twice as likely as men to choose battery or non-electric decorations (41% vs 20%), and men were more likely to take no steps (32% vs 21%).
How Do Americans Pay for Halloween Decorations?
Decorations get paid for somehow. We asked Americans whether they have used credit or buy now, pay later, what they have given up to afford their displays, and whether they regret the spending afterward.
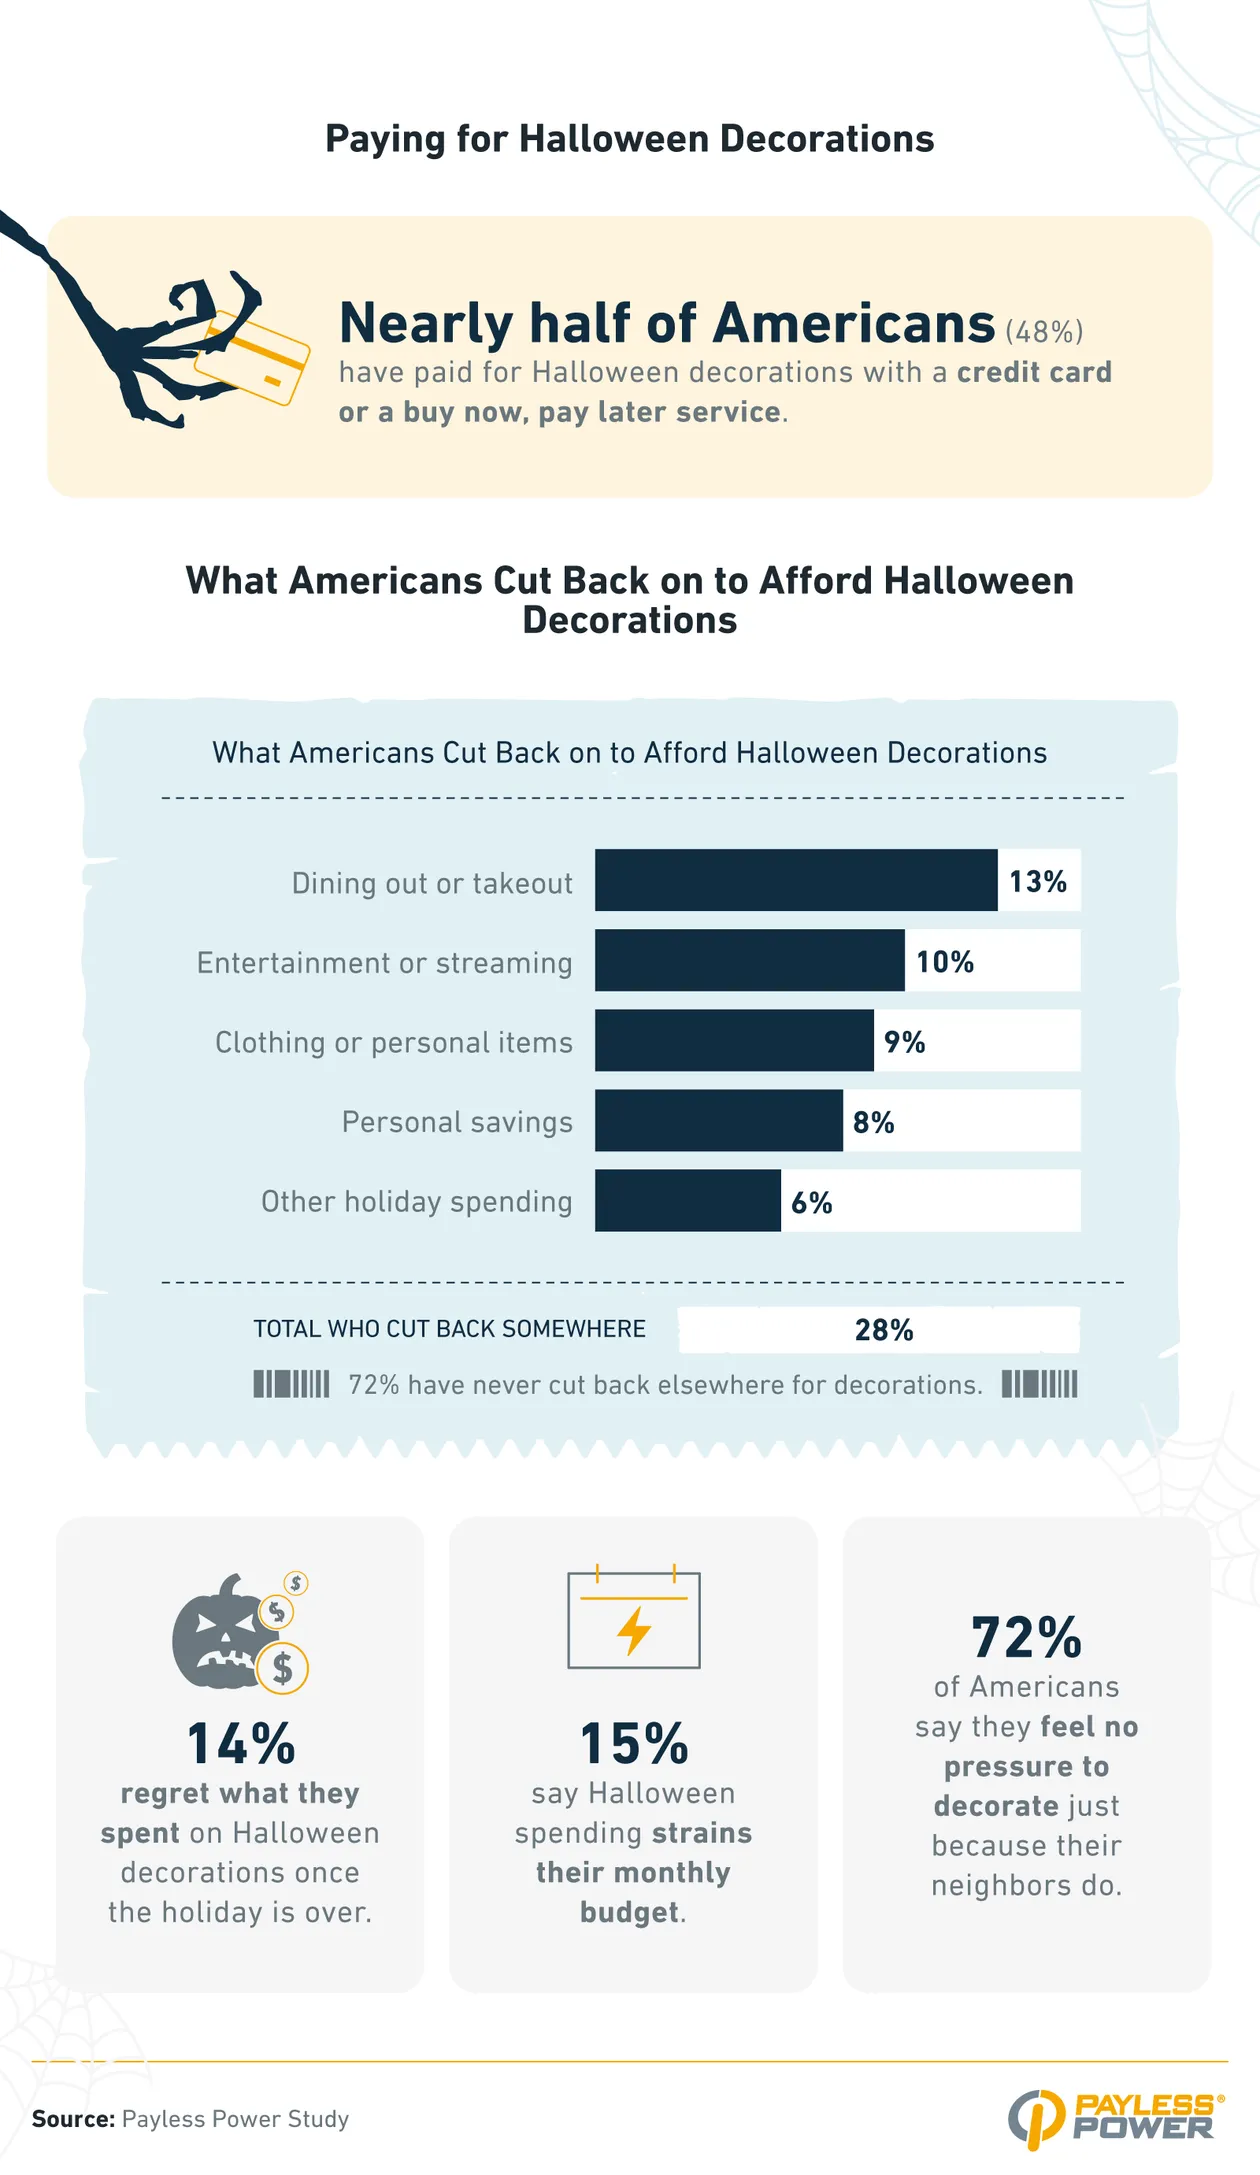
- Nearly half of Americans (48%) have paid for Halloween decorations with a credit card or a buy now, pay later service.
- 1 in 10 Americans (10%) used buy now, pay later specifically, rising to 12% among millennials.
- Millennials were the most likely to have paid for decorations with a credit card or buy now, pay later (51%), followed by Gen X (49%), Gen Z (45%), and baby boomers (36%).
- More than 1 in 4 Americans (28%) have cut back on other spending to afford Halloween decorations. Gen Z Americans were the most likely to have done so (38%), followed by millennials (29%), Gen X (21%), and baby boomers (14%).
- Americans who use powered decorations were nearly three times as likely as those who decorate without electricity to have cut back on other spending to afford decorations (32% vs 12%).
- Only 14% of Americans regret what they spend on decorations once Halloween is over. Millennials (17%) and Gen Z (16%) are the most likely to, while Gen X (10%) and baby boomers (3%) are the least likely to.
- Nearly 3 in 4 Americans (72%) say they feel no pressure to decorate just because their neighbors do. Baby boomers are the most likely to feel no pressure (86%), followed by Gen X (76%), millennials (70%), and Gen Z (65%).
- Americans plan to spend a median of $50 on Halloween decorations this year. That rises to $60 among those who use powered decorations and drops to $20 among those who decorate without electricity.
Where Do Halloween Decorations Cost the Most to Run?
We priced three sample displays and 11 common decorations at each state’s October electricity rate. Most lights and props were modeled for 5 hours per night across all 31 nights, while the fog machine ran for 1 hour per night.
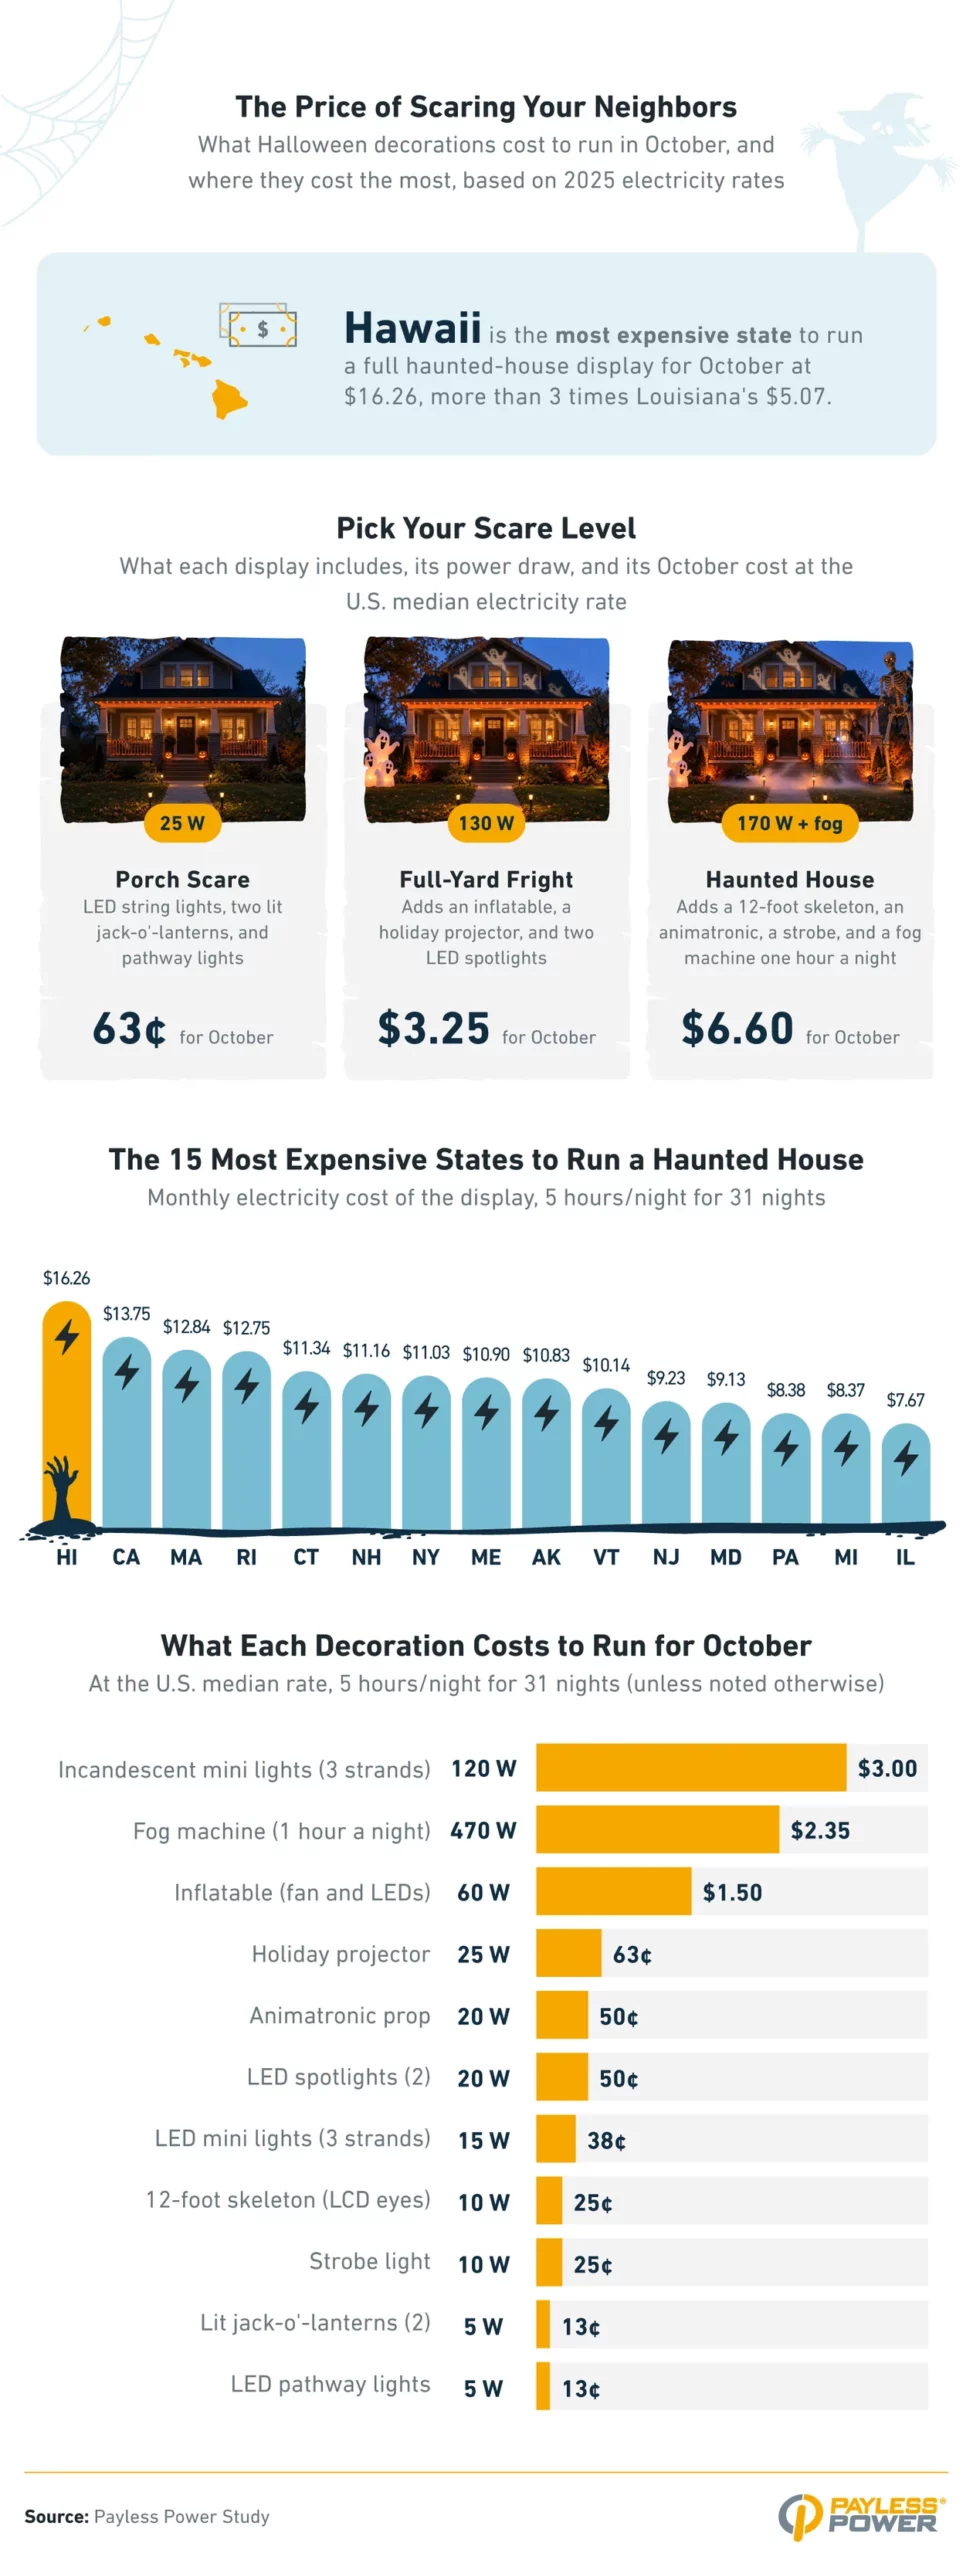
- Running a full haunted-house Halloween display every night in October costs about $7 in electricity at the typical U.S. rate, $16 in Hawaii, and about $5 in the cheapest states.
- Hawaii is the most expensive place to scare the neighbors at about $16 in electricity for October, followed by California ($14) and Massachusetts ($13). Louisiana ($5.07), Idaho ($5.10), and North Dakota ($5.25) are the cheapest.
- A modest porch display of LED string lights, two lit jack-o’-lanterns, and pathway lights costs under $1 per month in 41 of 50 states and $1.54 in Hawaii.
- The 12-foot skeleton is one of the cheapest things in the yard. Its LCD eyes are the only powered part and draw about 10 watts, which is roughly 25 cents per month at the typical U.S. rate.
- The fog machine is the priciest prop. Running 1 hour a night, it costs about $2.35 a month at the typical rate, more than the inflatable’s fan running 5 hours a night ($1.50).
- Three strands of incandescent mini lights cost about $3 a month to run at the typical rate. The same lights in LED cost 38 cents.
- A Texas display costs almost exactly the national figure ($6.60 for the Haunted House), since Texas’ electricity rate sits at the U.S. median.
What It Costs to Run a Haunted House Display in Every State
Monthly electricity cost of the full Haunted House display — string lights, inflatable, projector, two spotlights, a 12-foot skeleton, an animatronic, a strobe and a fog machine — running five hours a night for 31 nights (fog one hour a night), priced at each state’s October 2025 residential electricity rate.
| # | State | Rate /kWh | Cost for October |
|---|---|---|---|
| 1 | Hawaii | 39.7¢ | $16.26 |
| 2 | California | 33.6¢ | $13.75 |
| 3 | Massachusetts | 31.4¢ | $12.84 |
| 4 | Rhode Island | 31.2¢ | $12.75 |
| 5 | Connecticut | 27.7¢ | $11.34 |
| 6 | New Hampshire | 27.3¢ | $11.16 |
| 7 | New York | 26.9¢ | $11.03 |
| 8 | Maine | 26.6¢ | $10.90 |
| 9 | Alaska | 26.5¢ | $10.83 |
| 10 | Vermont | 24.8¢ | $10.14 |
| 11 | New Jersey | 22.6¢ | $9.23 |
| 12 | Maryland | 22.3¢ | $9.13 |
| 13 | Pennsylvania | 20.5¢ | $8.38 |
| 14 | Michigan | 20.5¢ | $8.37 |
| 15 | Illinois | 18.7¢ | $7.67 |
| 16 | Wisconsin | 18.4¢ | $7.52 |
| 17 | Delaware | 18.3¢ | $7.49 |
| 18 | Ohio | 17.9¢ | $7.30 |
| 19 | Indiana | 17.3¢ | $7.10 |
| 20 | Alabama | 16.7¢ | $6.84 |
| 21 | Minnesota | 16.4¢ | $6.70 |
| 22 | Virginia | 16.4¢ | $6.69 |
| 23 | Colorado | 16.3¢ | $6.65 |
| 24 | West Virginia | 16.2¢ | $6.62 |
| 25 | Oregon | 16.2¢ | $6.61 |
| 26 | Texas | 16.1¢ | $6.59 |
| 27 | Florida | 15.7¢ | $6.42 |
| 28 | South Carolina | 15.7¢ | $6.40 |
| 29 | Arizona | 15.6¢ | $6.36 |
| 30 | Kansas | 15.2¢ | $6.21 |
| 31 | Wyoming | 15.1¢ | $6.18 |
| 32 | North Carolina | 15.1¢ | $6.16 |
| 33 | New Mexico | 14.9¢ | $6.12 |
| 34 | Georgia | 14.5¢ | $5.95 |
| 35 | Mississippi | 14.5¢ | $5.92 |
| 36 | Oklahoma | 14.4¢ | $5.90 |
| 37 | Montana | 14.3¢ | $5.84 |
| 38 | South Dakota | 14.1¢ | $5.77 |
| 39 | Washington | 14.1¢ | $5.75 |
| 40 | Nevada | 13.8¢ | $5.63 |
| 41 | Utah | 13.7¢ | $5.60 |
| 42 | Kentucky | 13.6¢ | $5.57 |
| 43 | Iowa | 13.5¢ | $5.52 |
| 44 | Arkansas | 13.3¢ | $5.43 |
| 45 | Nebraska | 13.1¢ | $5.37 |
| 46 | Tennessee | 13.1¢ | $5.34 |
| 47 | Missouri | 12.9¢ | $5.30 |
| 48 | North Dakota | 12.8¢ | $5.25 |
| 49 | Idaho | 12.5¢ | $5.10 |
| 50 | Louisiana | 12.4¢ | $5.07 |
Modeled estimate, not measured bills. Source: Payless Power analysis of U.S. Energy Information Administration October 2025 residential rates and typical manufacturer wattages. District of Columbia excluded.
Methodology
October electric bills by state come from the U.S. Energy Information Administration’s retail sales data (EIA Open Data API, residential sector, monthly, January 2015 through December 2025, pulled September 2026), the same series published in the Electric Power Monthly. The average October bill per household is residential revenue divided by residential customers, and average usage is residential sales divided by customers, so both are per utility account rather than per person. States are ranked by the October 2025 bill, with the highest first, and the national median is the median across the 50 states, with the District of Columbia excluded from both.
Decade changes compare October 2015 with October 2025. The $124 figure for what October 2025 usage would have cost at 2015 prices multiplies 2025 usage by the 2015 rate and is an illustration, not a real bill. Dollar figures are not adjusted for inflation and are rounded to whole numbers, and rates are rounded to one decimal. The one inflation-adjusted comparison uses the Bureau of Labor Statistics’ Consumer Price Index for all urban consumers (not seasonally adjusted) for October 2015 and October 2021. BLS did not publish an October 2025 index because of the federal shutdown, so we used the October 2025 index number published by the U.S. Treasury under its inflation-protected securities rules. October bills sit well below the summer air-conditioning peak in Texas and most southern states, so these figures describe the Halloween season, not the year’s highest bill.
The display-cost estimates are a model, not measured bills. We priced three sample displays at each state’s October 2025 residential rate from the EIA data above, with lights and props running 5 hours a night for 31 nights, the most common run time in our survey, and a fog machine running 1 hour a night. Wattages are typical manufacturer ratings: about 5 watts per strand of LED mini lights and 40 watts for incandescent (Christmas Lights Etc), about 60 watts for a standard inflatable with a fan and LEDs (Family Handyman), about 470 watts for a party fog machine while heating (EcoFlow), about 10 watts for the plug-in LCD eyes that are the only powered part of a 12-foot skeleton, and 25 watts for a holiday projector, 20 watts for an animatronic prop, and 10 watts each for an LED spotlight and a strobe light. Costs at the typical U.S. rate use the median of the 50 state rates (16.1 cents). Display costs are shown to the cent because most are under $10.
Additionally, Payless Power surveyed 1,006 Americans about how Halloween decorations affect their electric bills and budgets. We asked what decorations people use and how long they run them, whether rising energy costs have changed how they decorate, and how their spending compares with last year. Respondents by generation were 50% millennials, 25% Gen X, 18% Gen Z, and 7% baby boomers. By gender, 50% were women, and 49% were men. The survey was fielded on September 15, 2026.
About Payless Power
Payless Power is a Texas energy provider that believes in making electricity accessible to all, regardless of credit history. We offer flexible, prepaid, and traditional energy plans with competitive pricing and no credit checks, empowering Texans to take control of their energy costs.
Fair Use Statement
The data, findings, and visuals contained in this study are free to share and republish for noncommercial purposes. Please provide a link back to Payless Power so readers can access the full research and methodology.
Payless Power is a thought leader in the energy industry, focusing on technology, innovation, and accessibility. The company's expertise includes the Texas energy grid, infrastructure improvements, weatherization safeguards, and the advancement of clean, renewable resources. Since 2005, Payless Power has provided energy solutions to residences and businesses across the Lone Star state.




What our customers are saying
See why our power customers say we're the best electricity provider in Texas!

I was worried about getting electricity for my home through a prepaid company. I was calling around to see different rates then going through all the hassle of credit checks while dropping points each…
I have been with this company for several years and have been very happy since. Even when I moved, they made my usually stressful situation very easy and carefree. I recommend them to everyone that I…
I have enjoyed the service for 2 years now. In the beginning this service was planned to be temporary but with the service being so effective for me i decided to keep it for the long haul. I’m a happy customer.
*Same-day connection is available Monday through Saturday when you fund your account before 6:00 PM. Accounts funded after 6:00 PM, on Sundays, or on holidays will be connected first thing the next morning. Actual timing depends on your local utility company. Connection times are not guaranteed and may be delayed due to meter issues, switch holds, system outages, or weather. Our support team is always standing by to help.
About Payless Power
Payless Power wants to be your Texas electric company.
Whether you live in a large city or small town, Payless Power can save you money on your Texas electricity. We serve customers in over 400 deregulated communities in Texas with both traditional, postpaid plans on monthly billing cycles, and prepaid electricity that is pay-as-you-go with no deposit or credit check required.
We work with principal utilities throughout the state to provide electricity. The utilities are: Oncor in the Dallas and Fort Worth Metroplex and various parts of West Texas; CenterPoint Energy in Houston and the surrounding areas; AEP Central in Corpus Christi and surrounding areas; and AEP North in Abilene and other North Texas communities.